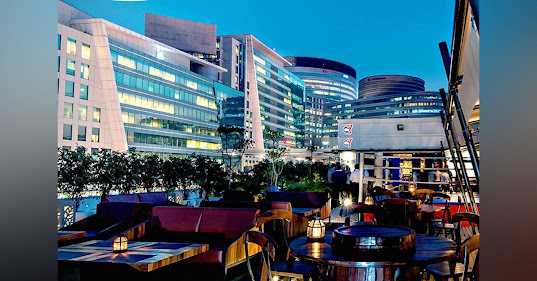
An overview of Indian SEZ
SEZ (Special Economic Zone) is a geographical region where economic laws are more liberal than country's domestic economic law. The incentives and facilities offered to the units in SEZs for attracting investments into the SEZs, including foreign investment include:-
1. Duty free import/domestic procurement of goods for development, operation and maintenance of SEZ units.
2. 100% Income Tax exemption on export income for SEZ units under Section 10AA of the Income Tax Act for first 5 years, 50% for next 5 years thereafter and 50% of the ploughed back export profit for next 5 years.
3. Exemption from Central Sales Tax, Exemption from Service Tax and Exemption from State sales tax. These have now subsumed into GST and supplies to SEZs are zero rated under IGST Act, 2017.
Asia’s first Export Promotion Zone (EPZ) was set up in Kandla in 1965. Seven more zones were set up thereafter. China is pioneer in this SEZs when Deng Xiaoping after liberalization of Chinese economic has planned to setup SEZs (1979) to attract foreign investments in namely Shenzhen in the Pearl River Delta region, Zhuhai and Shantou in Guangdong and Xiamen (Amoy) in Fujian Province. Special Economic Zones (SEZs) Scheme in India was conceived by the Commerce and Industries Minister Murosoli Maran during a visit to Special Economic Zones in China in 1999. India has 351 SEZs notified under the SEZ Act, 2005 (came into effect on 10 February 2006) out of which 238 are operational. In FY19, India exported goods worth ₹7.01 lakh crore (US$ 101 billion) from those SEZs, which is up from ₹4.94 lakh crore (US$ 69 billion) in FY14 and 70 times increase from FY01 based on the data shared by Export Promotion Council of India for Export Oriented Units and SEZs (EPCES). In FY 20, the value rose to ₹7.97 lakh crore, up from just ₹2.21 lakh crore in FY10. It also employed 20.6 lakh people. Investment in these increased from ₹2.36 lakh crore in FY13 to ₹5.07 lakh crore in FY19. Indian SEZ's share of export increased from 5% in 2001 to 30% in FY19. One problem is roughly 143 out of 238 (60%) SEZs are IT/ITES focused. IN FY20, sectors that saw healthy growth in this financial year include gems & jewelry (13.3%), trading & logistics (35%), leather & footwear (15%), non-conventional energy (47%), and textiles & garments (17.6%). On the other hand Chinese SEZs have contributed 22% of China’s GDP, 45% of total national foreign direct investment, and 60% of exports with an estimated 30 million jobs. Some of the biggest SEZs in India are -
1. SIPCOT IT and Industrial Park, Tamil Nadu
2. SEEPZ, Mumbai
3. MIDC SEZs, Maharashtra
4. Cochin SEZs, Kerala
5. DLF CyberCity, Gurugram
6. Vishakhapatnam SEZ, Andhra Pradesh
7. Falta SEZ, West Bengal
8. Noida Export Processing Zone, Uttar Pradesh
The Delhi National Capital Region (NCR) hosts about 14 SEZs, which are primarily located in satellite cities like Gurugram (formerly Gurgaon, Haryana state) and Noida. The Bengaluru (formerly Bangalore) area hosts at least 18 SEZ, which are mostly located on the city’s outskirts. Meanwhile, Tamil Nadu has the highest number of operational SEZs (40), followed by Karnataka (32), Maharashtra (31) and Telangana(30).
However, about 120 SEZs across India remain non-operational, with half of the land notified for SEZs lying vacant. In India, SEZs are identified with tax and exchange control relaxations. But the Chinese SEZs were basically areas exempted from the application of various domestic laws, rules and procedures by giving each SEZ chief, usually a senior trusted party leader, wide discretion to adapt international best practices. An increased number of units in SEZs would improve their utilization - many SEZs are spread across more than 400-500 acres (equal to 378 football fields combined) but have only a few exporting units, resulting in acute under-utilization of the land allotted.


Comments
Post a Comment